|
Box 1. Longer term trends in China's food prices
Since the early 2000s, China's food prices have trended up (Box Figure 1). Agricultural prices have risen 8 percent per year on average since 2000, after falling during the second half of the 1990s. PPI food prices (factory gate) have risen much less because prices of other inputs into the food processing industry have gone up less and rapid productivity growth in food processing has dampened the transmission of higher raw food prices. However, food prices at the retail level have also risen rapidly. Many food products are not processed. Thus, much of the higher vegetable prices and, in 2007/8, higher pork prices, show up undampened in the CPI data. Consumer food prices are also driven up by wage and other cost pressures in the logistics and retail sector.
Supply factors are key in explaining China's food price increases. Agriculture productivity can typically not increase as easily as in manufacturing. Spectacular growth of China's manufacturing productivity and production has kept down manufacturing prices. Expanding agricultural production is constrained by the availability of land—a key production factor—and yields per hectare cannot be raised easily as productivity in manufacturing since they are already quite high (there is plenty of room for raising labor productivity in agriculture, but that largely entails people moving out of the sector). Thus, higher prices of energy and other costs increase in the 2000s drove up food prices substantially.
The impact of changes in food demand on food prices in the 2000s is less obvious. It is often argued that increased demand for food and changes in diets in emerging and developing economies and resulting pressure on scarce resources such as land are key drivers of higher food prices. However, in China the changes in diet and resulting pressure on scarce resources were much more rapid in 1990-2000, when food price increases were subdued, than in 2000-2009. Per capita daily calorie intake rose steadily from 1960 until 2000 but then it reached a ceiling broadly at the level of high income Asian neighbors such as Japan and South Korea. The resulting changes in the composition of the usage of farmland were also more rapid in 1980-2000 than in 2000-09. The main trend during 1980-2009 in this regard has been a rise in the amount of land used for products other than grain, particularly vegetables and fruit. However, this shift was much more pronounced before 1990 than since then (Box Table 1).
China's food prices are also influenced by global markets and globally supply factors have also been key, as have been biofuels. Many of China's food prices follow international ones, with wheat and rice prices as the big exceptions. Since 2004, international food prices have outpaced manufacturing prices substantially. However, for most of the post war period, global food prices did not increase much and, relative to manufacturing prices, they declined strongly until the early 1990s (Box Figure 2).
Several factors contributed to the rise in global food prices since 2004 (Mitchell (2008) and Alexandratos (2008)).* First, sharply higher oil prices increased the production costs of agriculture, notably via higher fertilizer prices (the WB estimates that the energy intensity of agriculture is 4.4 times that of manufacturing, globally). Higher oil prices also stimulated biofuel related demand for cereals, diverting a rapidly growing share of cereals away from food consumption. Second, global grain stocks had shrunk during 1997-2003, when consumption continued to grow while low prices kept global grain production stagnant. Thus, by around 2004, global stocks were relatively low. Third, supply shocks from weather induced crop failures in key producing countries.
Again, the role of food demand is less obvious. Growth in global demand for cereals (rice, wheat, and course grains) rose from 1.6 percent per year in 1992-2001 to 1.9 percent per year in 2002-08. However, the acceleration was because of biofuel demand. Excluding US biofuel related corn demand, global cereal demand growth actually slowed to 1.4 percent per year in 2002-2008, continuing its gradual deceleration (Box Figure 3). Adding biofuel related cereal demand in other countries would further reduce the measured growth of global food oriented cereal demand.
Looking ahead, several of the features that have emerged are likely to remain part of the medium term outlook. Domestically, the supply side effects described above are likely to continue to operate. On the demand side, consumers are likely to continue to shift to higher quality foods and increased variety. The scope for such shifts has bounds, though; average per capita daily calory intake and the overall composition of diets in China is broadly already quite similar to that in Japan and South Korea. At the retail level, the non tradable component of food is large. Thus, with continued rapid overall economic growth, wage increases and Balassa-Samuelson effects, the price of food at the retail level is likely to continue to outpace prices of manufactured goods strongly. Internationally, the impact of energy prices on food prices is likely to remain strong. And the impact of global prices on many of China's food prices is also likely to remain strong, even though the volatility of international grain prices in recent years has probably made China's policymakers more keen to retain the controls on grain prices. Indeed, China recently announced a price control scheme for cotton. Most experts continue to think that food prices will eventually stop increasing as additional capacity comes on line. However, even in a benign medium term scenario price volatility along the way could well remain high, possibly accentuated by climate change, as it perhaps is already.
* Mitchell, D., "A Note on Rising Food Prices", Policy Research Working Paper 4682, World Bank and
http://www.fao.org/fileadmin/templates/esa/Global_persepctives/Long_term_papers/FoodPriceSurges-Alexandratos.pdf
Box 2. The evolution of China's pattern of growth—what do investment patterns suggest?
During the 11th Five-Year Plan period, some modest progress was made with rebalancing towards more services and domestic consumption. On the production side, the secondary (industrial) sector grew broadly as fast as the services sector, in real terms. The share of the service sector in GDP increased because of more rapid price increases in the services sector and a fall in the share of agriculture. However, industry clearly remains very important. On the expenditure side, consumption has so far substantially lagged investment, which in 2010 made up more than 46 percent of GDP.
Looking forward, the pattern of investment across sectors matters. Channeling resources to new sectors and activities is a key element of transforming the growth pattern.
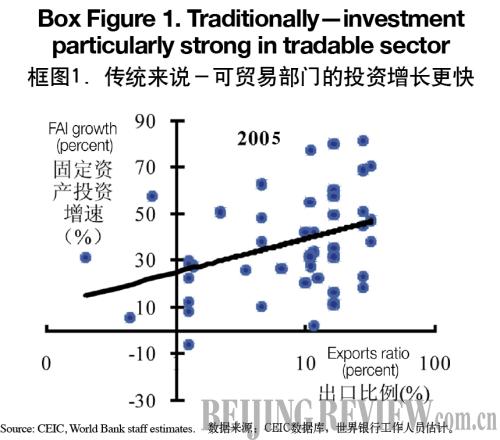
Traditionally, investment growth was particularly strong in the tradable sector. As Box Figure 1 shows for 2005, in 2004-07 sectors with a higher ratio of exports to (gross) output on average saw more rapid growth of fixed asset investment (FAI).
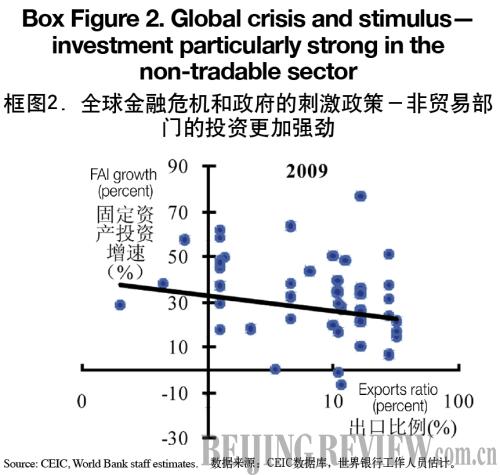
When the global crisis broke out, this pattern changed. Investment in export oriented manufacturing was affected by the global slump and emergence of spare capacity. For instance, in the textile sector—the sector with the highest export ratio—investment slowed down sharply in 2008 and growth remained subdued in 2009. Moreover, China's stimulus boosted investment in non-tradable sectors, notably in infrastructure. Thus, as indicated in Box Figure 2, in 2009, investment growth was on average higher in more domestically-oriented sectors.
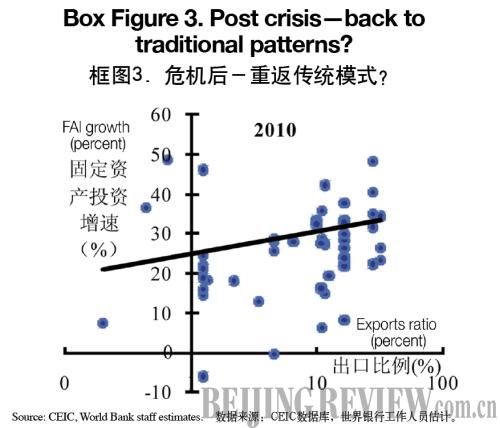
However, it is too early to say that this rebalanced pattern of investment will be sustained. Box Figure 3 suggests that the traditional pattern seems to have re-emerged itself in 2010 (and the first months of 2011). This is possibly temporary, after the turmoil in 2008-09. However, at a minimum rebalancing is not yet on course.
|